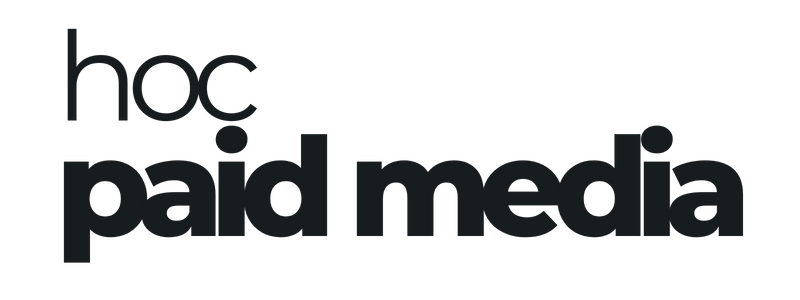

If you’re running traffic to an e-commerce site and you’re not investing in Conversion Rate Optimisation (CRO), you’re likely leaving serious revenue on the table. Too many brands pour budget into paid media without first understanding how well (or poorly) their site is converting that traffic.
Here is a rigorous 13-point CRO research process that we use to identify exactly where an e-commerce site is leaking money – and more importantly, what to do about it.
1. GA4 Deep-Dive: Finding the Hidden Stories in Your Data
We start with GA4 because if your data isn’t clean and insightful, the rest of your decisions are guesswork. We look at:
- Funnel performance – Where exactly are users dropping off, and why?
- Conversions by browser, device, and screen size – Is your site underperforming on certain tech setups?
- High traffic, high bounce pages – These pages are grabbing attention but failing to hold it.
- Low-conversion landing pages – We pinpoint which pages need love from both a design and messaging perspective.
- Pages with high traffic but poor load speeds – Speed kills conversions, plain and simple.
- Performance by traffic source – Are some channels sending unqualified traffic?
- New vs returning user behaviour – This helps us tailor messaging and UX for both first-time visitors and loyal customers.
2. UI/UX Audit: A 385-Point Deep Dive Into User Experience
Yes, 385 points. That’s how granular we get when auditing a site’s UI/UX across key templates like Home, PLPs, PDPs, Cart, Checkout, Landing Pages and Confirmation Pages.
We review design consistency, hierarchy, mobile experience, trust signals, navigation clarity, and more. The goal is to identify friction that disrupts the buyer journey. Small tweaks can lead to big lifts when they’re based on the right observations.
3. Full Site Speed Audit: Performance Is Part of UX
We use tools like GTMetrix to diagnose what’s slowing the site down. Speed isn’t just a developer’s concern – it’s a conversion killer if neglected. Shoppers won’t wait more than a few seconds. Every additional second of load time can tank conversions by up to 20%.
4. Market Analysis: Know the Playing Field Before You Make a Move
We look at three core factors:
- Mass desire – What is the underlying desire that your product taps into?
- Prospect awareness – Are users problem-aware, solution-aware, or product-aware? Your messaging should change accordingly.
- Market sophistication – In a mature market, you’ll need more nuanced messaging. In an emerging one, education is key.
Too many brands skip this and end up sounding like everyone else.
5. Competitive Analysis: Find the Gaps in the Market
You’re not marketing in a vacuum. We assess:
- How your brand and site compare to your competitors
- What makes your competitors unique (and how to out-position them)
- The offers and hooks they’re using
- How the market perceives them versus you
This tells us how to carve a stronger, more distinctive position.
6. On-site Surveys: Hear Directly From Your Visitors
These micro-surveys surface gold. We ask:
- What’s holding you back from purchasing today?
- What do you need to see or know before buying?
- What’s important to you when choosing a product like this?
It’s one of the simplest ways to bridge the gap between what you think customers want and what they actually do.
7. Search Analysis: Understand Intent Through On-site Search
If your site has search functionality, it’s a live feed of what users want. We analyse:
- How often visitors use search
- What keywords they’re typing in
- How well the results satisfy that intent
A poor search experience can ruin even the best-designed site.
8. Customer Surveys: Insights From Buyers and Non-buyers Alike
These are different from on-site polls. We send structured surveys to past customers and prospects to uncover:
- Their goals and motivations
- The objections or hesitations that nearly stopped them from buying
- What alternatives they considered
- Which messages or features mattered most
You don’t need a massive sample size – even 20-30 responses can spark real insight.
9. Review Mining: What Customers Are Saying (and What They Aren’t)
Reviews – both for your brand and your competitors – are rich in voice-of-customer data. We look for:
- Repeated pain points
- Desired outcomes
- Unexpected wins or delights
- Features or benefits that aren’t resonating
You’ll often uncover patterns that your own team missed because you’re too close to the product.
10. Customer Service Insights: Your Support Team Knows What’s Broken
Speak to your customer service team. Ask:
- What are the most frequent questions?
- What do people return products for?
- Where do people get confused?
Your support inbox is one of the most overlooked CRO assets.
11. Heatmaps and Session Recordings: Watch the Journey
We use heatmaps and session recordings to see what analytics alone can’t show:
- What parts of the page are being ignored?
- Where are users rage-clicking or hesitating?
- Are CTAs being missed?
- Where are non-buyers getting stuck?
This kind of qualitative insight helps us prioritise fixes.
12. User Testing: First-Hand Feedback From Real Shoppers
This is where we get strangers to use the site while thinking out loud. We ask them to complete a task and narrate their experience. It reveals:
- Confusing interactions
- Navigation issues
- Content gaps
- Design flaws
This is especially valuable when paired with your analytics data.
13. Economics Analysis: You Can’t Optimise What You Don’t Understand
Last but not least – we look at your numbers.
- What’s your CAC vs AOV?
- Do you know your unit economics?
- Are you profitable on first purchase or relying on LTV?
- How efficient is your checkout flow in monetary terms?
Knowing your numbers is the difference between optimising for vanity metrics and optimising for actual growth. If you want to go deeper here, we break the maths down in the metrics and KPIs that really matter in e-commerce and in our guide to mastering unit economics in paid ads.
The 13-point CRO toolkit: what to use for each step
A framework is only useful if you can actually run it. Here’s the tool we’d reach for at each step, roughly how long it takes, and what you should end up with. Times assume a single e-commerce site and one person doing the work; the qualitative research steps (surveys, heatmaps, testing) need a week or two of live data collection on top of the setup time.
| Research Step | Recommended Tool | Time to Run | Output/Deliverable |
|---|---|---|---|
| 1. GA4 deep-dive | GA4 (free) | Half a day | Ranked list of drop-off points and weak pages |
| 2. UI/UX audit | Heuristic checklist across key templates | 1–2 days | Scored friction audit per template |
| 3. Site speed audit | PageSpeed Insights + GTmetrix | 1–2 hours | Core Web Vitals issues to fix |
| 4. Market analysis | Desk research | Half a day | Positioning and awareness brief |
| 5. Competitive analysis | Manual teardown + SimilarWeb | Half a day | Competitor gap and offer map |
| 6. On-site surveys | Microsoft Clarity or Hotjar surveys | 30 min setup + 1–2 weeks live | Ranked list of purchase objections |
| 7. Search analysis | GA4 site-search reporting | 1–2 hours | Intent and content-gap list |
| 8. Customer surveys | Typeform or Google Forms | 1 hour + 1–2 weeks | Voice-of-customer themes |
| 9. Review mining | Trustpilot, Amazon, competitor reviews | Half a day | Voice-of-customer swipe file |
| 10. Customer service insights | Helpdesk export (e.g. Gorgias/Zendesk) + a chat with the team | 1–2 hours | FAQ and objection list |
| 11. Heatmaps and recordings | Microsoft Clarity or Hotjar | 30 min setup + 1–2 weeks | Friction clips and problem pages |
| 12. User testing | Maze or UserTesting | Half a day + sessions | Prioritised usability issues |
| 13. Economics analysis | Spreadsheet + GA4 | 2–3 hours | Unit-economics model (CAC, AOV, contribution) |
A quick note on tools, because a couple have changed. Microsoft Clarity is genuinely free, with no cap on session recordings or heatmaps, and it now bundles AI session summaries in that free tier — so there’s no reason to skip step 11 on budget grounds. Hotjar is now part of Contentsquare and splits into two priced products: Experience Analytics for heatmaps and recordings, and Voice of Customer for surveys. It still has a free tier, but if you want both heatmaps and surveys from Hotjar you’re buying two things, which is why Clarity plus a simple form tool is often the cheaper starter stack.
Copy-paste survey templates
Steps 6 and 8 are the highest-leverage research you can run, and they’re the two people most often get wrong by asking vague questions. Here’s the actual wording to start from.
On-site poll (step 6) — trigger these one at a time on product and cart pages, not all at once:
- What’s stopping you from buying today?
- What one thing would make you more likely to buy right now?
- What information were you hoping to find on this page but couldn’t?
- If you decided not to buy, what tipped it?
- On a scale of 1–10, how easy was it to find what you needed? (follow up: what would have made it a 10?)
Post-purchase and prospect survey (step 8) — send to recent buyers, and separately to leads who didn’t convert:
- What problem were you trying to solve when you found us?
- What nearly stopped you from ordering?
- What other options did you consider, and why did you pick (or not pick) us?
- Which part of the product or offer mattered most in your decision?
- How would you describe us to a friend in one sentence?
- (Non-buyers only) What would we have needed to change for you to buy?
Keep both short, use mostly open questions, and read the answers looking for the exact phrases customers use — that language is your best source of new headline and product-page copy.
From research to a ranked test backlog
The point people miss is that research is not the finish line. Thirteen streams of insight are worthless until they become a prioritised list of tests. Turn each finding into a hypothesis in the form: because we saw [evidence], we believe changing [element] will improve [metric] for [audience].
Then score every hypothesis so you test the highest-value ideas first. Two well-known models do the job:
- ICE — score each idea 1–10 on Impact, Confidence and Ease, then average the three (Impact + Confidence + Ease ÷ 3). It’s fast and good for getting a backlog moving, but the scores are subjective. ICE was created by Sean Ellis for growth experiments.
- PXL — CXL’s model replaces the guesswork with around ten yes/no questions tied to evidence: is the change above the fold, is it on a high-traffic page, is it backed by heatmap or survey data, and so on. It takes longer but is far less subjective, which matters when you’re spending real budget on development.
Use ICE when you need speed and PXL when you need defensibility. Either way, the output is the same: a ranked backlog where the top items are the tests worth building first.
A worked example: from insight to test
Here’s how the framework produces an outcome rather than just a folder of data. It’s illustrative, not a specific client result, but it shows the chain.
- Insight (steps 1, 6, 11): GA4 shows a high drop-off on the product page for mobile users, on-site polls repeatedly say “I couldn’t tell what the delivery cost would be,” and session recordings show people scrolling up and down the PDP hunting for it.
- Hypothesis: because shoppers can’t see delivery cost before the cart, we believe surfacing free-delivery thresholds and cost near the buy button will increase add-to-cart rate on mobile.
- Test: an A/B test showing a delivery-cost line under the “Add to basket” button on mobile PDPs.
- Read the result: if the variant lifts add-to-cart and checkout starts without hurting margin, you roll it out; if it doesn’t move, you’ve learned cheaply and move to the next backlog item.
One insight, one hypothesis, one test, one decision. Repeat that loop and CRO stops being guesswork.
How long it takes, and who does what
You don’t need to run all 13 steps in a single week, and you don’t need an agency for every one. A sensible order for an in-house team is: start with the data you already own (steps 1, 3, 7, 13) in the first few days, set the qualitative research running in parallel (steps 6, 8, 11, 12 all need a week or two to gather enough responses), and use that waiting time for the desk-based work (steps 2, 4, 5, 9, 10).
A marketer or analyst can comfortably own the GA4, speed, search and economics work with the tools above. The heuristic UI/UX audit and user testing are where an outside CRO specialist earns their fee, because a fresh, trained eye catches friction your team has stopped seeing. Budget roughly two to three weeks end to end for a first full pass, then treat it as a rolling process rather than a one-off.
Final Thoughts
Once you’ve nailed these 13 foundational areas, you’ll have a crystal-clear understanding of what’s really going on with your site.
From there, it’s no longer a guessing game. It’s a calculated optimisation process – with your customers, your market, and your numbers leading the way.
FAQ
What questions should an on-site CRO survey ask?
Keep it short and mostly open-ended. The most useful on-site poll questions are: “What’s stopping you from buying today?”, “What one thing would make you more likely to buy right now?”, and “What information were you hoping to find but couldn’t?” Trigger them one at a time on product and cart pages rather than all at once, and read the responses looking for the exact words customers use — that language becomes your best product-page and headline copy.
How do you prioritise CRO tests?
Turn each research finding into a hypothesis, then score every hypothesis so you build the highest-value tests first. The two common models are ICE (rate Impact, Confidence and Ease from 1–10 and average them — quick but subjective) and PXL (around ten yes/no questions tied to evidence like heatmap data and page traffic — slower but far more objective). Use ICE for speed, PXL when you’re committing real development budget.
What tools do I need to run this framework?
A lean, mostly free stack covers it: GA4 for quantitative data, Microsoft Clarity (free, unlimited) or Hotjar for heatmaps, recordings and on-site surveys, PageSpeed Insights and GTmetrix for speed, a form tool like Typeform or Google Forms for customer surveys, and Maze or UserTesting for moderated user testing. You can run most of the 13 steps without paying for anything beyond a survey tool.
How long does the 13-point process take?
Budget around two to three weeks for a first full pass. The data-led steps (GA4, speed, site search, economics) take a few days, but the qualitative research — surveys, heatmaps and user testing — needs a week or two of live data collection running in parallel. After the first pass, treat CRO research as a rolling process rather than a one-off project.
Can an in-house team run this, or do I need an agency?
Most of it is doable in-house. A marketer or analyst can own the GA4, speed, site-search and economics work comfortably. The heuristic UI/UX audit and user testing are where an outside CRO specialist adds the most value, because a trained, unfamiliar eye spots friction your own team has stopped noticing.

More insights.

A Simple System to Beat Meta Ad Fatigue
Creative fatigue killing your Meta ROAS? A simple, repeatable system to refresh ads before performance drops — with the exact signals to watch.

How We’re Scaling Meta Ads Profitably in 2025: A Framework That Actually Works
Most brands I speak with are spending serious money on Meta ads. Founders, heads of growth, marketing leads – they’re all trying to crack the same code. But nine times out of ten, their ad…
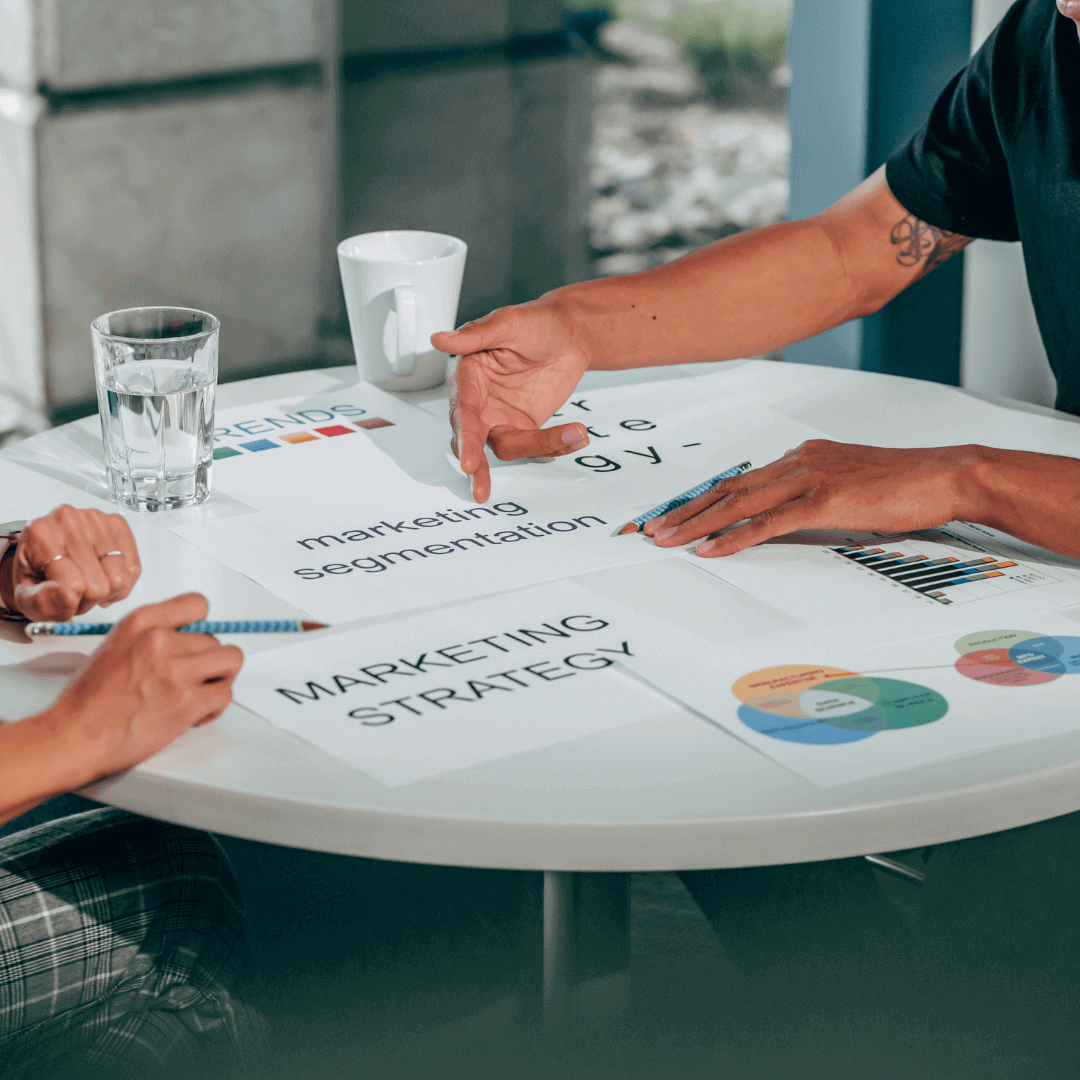
Bing Ads Remarketing: The Retargeting You're Missing
Microsoft (Bing) Ads dynamic remarketing is underused and cheap — how to set it up, who to retarget, and why it can outperform for B2B.
Want this kind of analysis on your account?
We'll review your campaigns and send you a written summary of the top wasted-spend opportunities. Three working days, no call required.