

Most marketers think they’ve got a handle on ROAS. They don’t.
It’s one of the most misunderstood metrics in paid media – and yet, it’s the one businesses obsess over the most. Open Meta Ads Manager or Google Ads, and you’ll see a shiny ROAS figure staring back at you. Looks impressive. But here’s the uncomfortable truth: it’s not telling you what you think it is.
That number you’re looking at? It’s an average. A mash-up of cold traffic, warm traffic, high-intent users, low-intent window shoppers, and time-decayed conversions all rolled into one. It blends someone who clicked yesterday with someone who clicked 29 days ago. The result? A misleading stat that leads to poor decisions.
The formula itself is innocent enough: ROAS is simply attributed revenue divided by ad spend. Spend £2,000, get £10,000 of attributed revenue back, and the platform reports a 5.0 ROAS. The problem isn’t the maths. It’s that revenue isn’t profit, an average isn’t a trajectory, and a platform-attributed number isn’t the truth about your business.
What You Really Need Is Cohorted ROAS
If you’re still making decisions based on platform-reported ROAS, you’re flying blind.
Instead of lumping everyone together, you need to analyse performance by cohort. That means tracking ROAS based on when a user first engaged with your brand. Day 1, Day 3, Day 7, Day 14, Day 30 – these milestones matter.
Cohorted ROAS is the revenue a group of customers has generated to date, divided by the spend it took to acquire them, measured at fixed intervals from their first touch. Same numerator and denominator as ordinary ROAS – but frozen to one intake of customers and tracked over time, so you see the curve rather than a single frame.
Let’s say you discover this pattern in your data:
- Users who hit 40% ROAS by Day 3 consistently reach 120%+ by Day 30
- But users who only reach 30% ROAS by Day 3 rarely break 70% by Day 30
With this level of insight, you can spot the winners early and scale with confidence. No more waiting 30 days for performance to play out. No more holding on to ad sets that are doomed from the start.
How to Build a Cohort ROAS View
Cohorting sounds heavy, but the first version fits in a spreadsheet. Here’s the method.
- Pull three columns per customer: first-touch date (the day they first converted or clicked), the ad spend attributed to that day or campaign, and revenue by day thereafter.
- Bucket customers by their first-touch week or day. Everyone who arrived in the same window is one cohort – you’re now following that group, not the account average.
- Track cumulative revenue at D1, D3, D7, D14 and D30 for each cohort, then divide by that cohort’s acquisition spend to get ROAS at each milestone.
- Compare cohorts side by side. A healthy account shows later cohorts hitting the same Day 7 ROAS as earlier winners – proof your scaling isn’t buying worse customers.
For a first pass, GA4’s cohort exploration plus a spreadsheet is enough. As volume grows, a warehouse-backed tool such as Triple Whale or Northbeam automates the pull and stitches first-party and platform data together. The tool matters far less than the habit of judging campaigns by their curve.
App Marketers Already Know This
This kind of analysis is standard in the mobile app world. App marketers live and breathe cohort data – whether it’s LTV curves, retention, or payback periods. They optimise based on how value accrues over time.
But outside of that space, most marketers are still stuck in legacy metrics:
- “Total revenue divided by total ad spend”
- Meta’s 7-day click attribution window
- Google Ads conversion windows of 30 to 90 days, now scored with data-driven attribution rather than the retired last-click model
These might give you a surface-level snapshot, but they don’t show you the trajectory of value. They can’t tell you who is scaling profitably and who isn’t. That’s a dangerous blind spot.
The Metrics That Actually Scale You: CAC, LTV and Payback
Cohorting fixes when you measure. These three fix what you measure – and each comes with a formula you can run today. For the full model behind them, see our guide to mastering unit economics in paid ads.
CAC (Customer Acquisition Cost) = acquisition spend ÷ new customers acquired. Spend £10,000 and win 50 new customers, and your CAC is £200. Keep it to new customers only – blending in repeat buyers flatters the number.
LTV (Lifetime Value) = average gross profit per customer × their expected lifetime. If a shopper spends £60 an order at a 60% gross margin, that’s £36 of gross profit per order; four orders over their lifetime gives an LTV of £144. For subscriptions, take monthly gross profit × average months retained – a £30 ARPU at 80% margin over 24 months is a £576 LTV. Note that LTV is built on gross profit, not revenue; an LTV quoted on top-line revenue will lie to you.
Payback period = CAC ÷ monthly gross profit per customer. A £200 CAC against £24 of monthly gross profit is an 8.3-month payback. The shorter it is, the faster you can recycle cash into more acquisition – which is why payback often governs how aggressively you can scale. We go deeper on the trade-off in CAC payback period vs repurchase rate.
POAS: Why Two Identical-ROAS Campaigns Can Have Opposite Profit
Here’s the number ROAS can’t see: margin. POAS (Profit on Ad Spend) is gross profit from ads ÷ ad spend, and it’s the single strongest “track instead” answer for ecommerce.
Picture two campaigns, both returning a 5.0 ROAS – £10,000 of revenue on £2,000 of spend.
- Campaign A sells low-margin products at 20% gross margin. That £10,000 carries just £2,000 of gross profit, so POAS is 1.0 – you’ve exactly broken even before overheads.
- Campaign B sells 60%-margin products. The same £10,000 carries £6,000 of gross profit, so POAS is 3.0.
Identical ROAS, wildly different businesses. Optimise on ROAS alone and you’d fund both equally; optimise on POAS and you’d pour budget into B and fix or cut A. This is exactly why we tell DTC brands to stop obsessing over CAC in isolation and read it against margin.
ROAS vs the Metrics That Actually Scale You
| Metric | What it measures | Formula | When to trust it |
|---|---|---|---|
| Platform ROAS | Attributed revenue against spend, inside one platform | Attributed revenue ÷ ad spend | A quick directional read within a single channel – never for profit or cross-channel calls |
| Cohorted ROAS | The revenue trajectory of one customer intake over time | Cohort revenue to date ÷ cohort spend, at D1/D3/D7/D30 | Deciding whether a campaign is on a profitable curve, and when to scale |
| CAC | The cost to acquire one new customer | Acquisition spend ÷ new customers | Setting spend limits and comparing channels on efficiency |
| LTV | Total gross profit a customer delivers over their lifetime | Avg gross profit per order (or month) × expected lifetime | Judging how much CAC you can actually afford |
| Payback period | Months to earn CAC back in profit | CAC ÷ monthly gross profit per customer | Cash-flow planning and deciding how fast to scale |
| POAS | The profit, not revenue, returned per £1 of spend | Gross profit from ads ÷ ad spend | Any decision where margin varies across products or campaigns |
For Ecommerce: Blended MER and New vs Returning ROAS
The unit economics above lean SaaS, but ecommerce needs two extra lenses. First, new vs returning ROAS: platform ROAS quietly banks revenue from customers you already own, so a campaign can look strong while acquiring almost nobody. Split it, and judge acquisition on new-customer ROAS alone. Second, blended MER (Marketing Efficiency Ratio) – total revenue ÷ total marketing spend across every channel. Where per-platform ROAS double-counts and fights over attribution, MER is one honest, board-level number that can’t be gamed by a pixel. For the wider ecommerce scorecard, see the metrics and KPIs that really matter in ecommerce.
For SaaS? ROAS Is Practically Useless
If you’re running paid ads for a SaaS brand, relying on ROAS is not just misleading – it’s a mistake.
Here’s why: let’s say you’re acquiring customers at £200 each. Those customers are worth £5,000 over the next year. But Google and Meta will only show you the immediate MRR – maybe £200, if that.
If you’re optimising for short-term ROAS, you’re undervaluing your acquisition strategy by a mile. You could kill campaigns that are actually performing brilliantly on a long-term basis.
Instead, you should be laser-focused on CAC, LTV and payback period – the metrics that give you a true sense of how sustainable and scalable your campaigns are. Not some front-loaded ROAS figure inside Ads Manager.
The Smarter Way to Scale
Here’s the bottom line: platform-reported ROAS is a vanity metric. It makes you feel in control, but it’s built on murky attribution windows and mixed-intent traffic. If you’re serious about scaling profitably, you need to shift how you measure success.
Start by:
- Tracking ROAS by cohort: D1, D3, D7, D30
- Building predictive models based on early ROAS indicators
- Prioritising CAC, LTV, payback and POAS when making decisions
It’s not as neat and tidy as plugging in to Google Ads and reading a number off the dashboard. But it’s how you make better decisions, faster. And that’s what separates the brands that grow from the ones that guess.
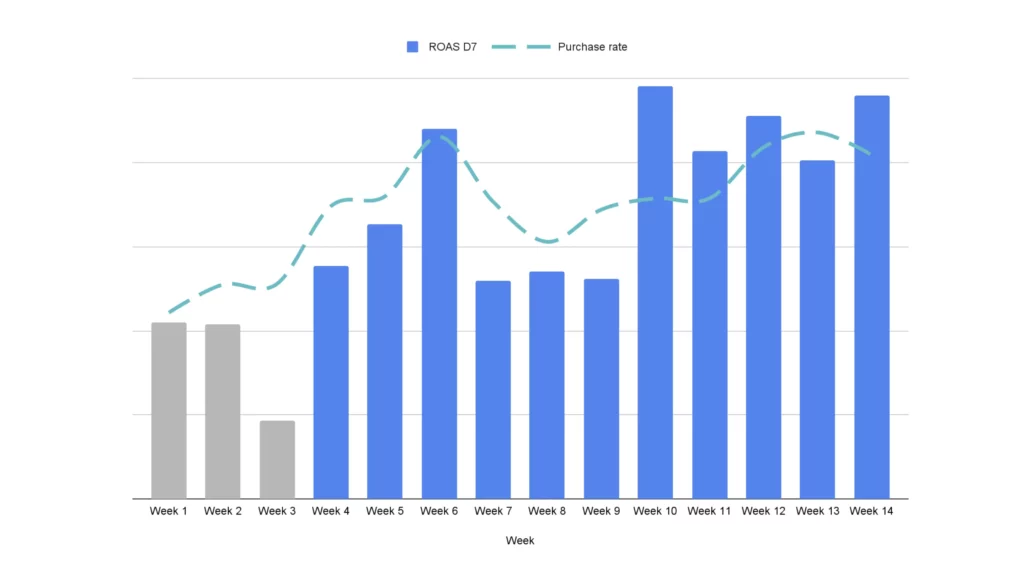
The chart below shows the principle in action: a client cohort where the early ROAS reading barely moved, while cumulative value kept climbing for weeks afterwards – exactly the trajectory a single platform ROAS figure would have hidden.
FAQ
Is a high ROAS ever a bad thing?
It can be. A high ROAS often just means you’re harvesting demand you already had – branded search or retargeting existing customers – rather than acquiring anyone new. If margin is thin or the number is inflated by returning buyers, a proud ROAS can sit on top of a campaign that isn’t actually growing the business.
What’s the difference between ROAS and POAS?
ROAS measures revenue per pound of ad spend; POAS measures gross profit per pound of ad spend. Because ROAS ignores margin, two campaigns with the same ROAS can have completely different profitability. POAS closes that gap, which is why margin-sensitive ecommerce brands lean on it.
How do I calculate cohorted ROAS?
Group customers by the date of their first touch, then track that group’s cumulative revenue divided by its acquisition spend at fixed milestones – D1, D3, D7, D14, D30. You’re following one intake of customers over time instead of averaging the whole account, so you see the trajectory rather than a single snapshot.
Which metric should I optimise for first?
Start with payback period and CAC against LTV. They tell you whether acquisition is sustainable and how fast you can recycle cash into more spend. ROAS and POAS then help you compare campaigns day to day, but they shouldn’t be the metric you set your whole strategy by.
Does platform ROAS still have any use?
Yes – as a quick, directional read inside a single channel. It’s fine for spotting a sudden drop or an obvious winner within Meta or Google. Just don’t use it to compare across channels or to make profit and scaling decisions, because attribution overlap and missing margin make it unreliable for those.

More insights.

CAC Payback vs Repurchase Rate: What to Fix First
CAC payback period or repurchase rate — which should you optimise first? How to tell which lever moves your growth fastest.

Returning Customer Rate: Why It's Not What You Think
Returning customer rate misleads more DTC brands than any other metric — what it really measures, and the number you should track instead.

Media Buying Unit Economics: 4 Metrics That Matter
The four unit-economics metrics every media buyer must track — CPP, CAC, margin and payback — to know if your ad spend is actually profitable.
Want this kind of analysis on your account?
We'll review your campaigns and send you a written summary of the top wasted-spend opportunities. Three working days, no call required.